
Thursday, June 25, 2020
Wednesday, June 24, 2020
Some design thinking diagrams that resonate with me

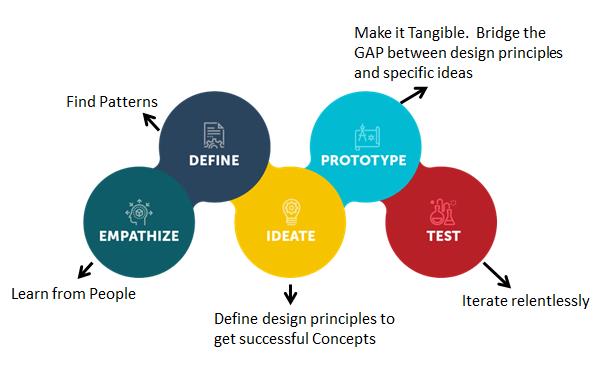
- Empathise:
- Research
- Create research plan
- Recruit and schedule interviews
- Customer interviews
- Frontline staff interviews
- Team lead interviews
- Existing research Research
- Competitor research
- Analysis and synthesis of research
- Understand impact and rootcause of problems.
- Identify opportunities
- Define:
- Immerse into probelm area
- Playback the research
- Impact analysis of problem areas
- Collect data to assess severity, scale and frequency
- Analyse the data
- Workshop with SMEs if required to understand severity, scale and frequency
- Prioritise problem areas
- Problem prioritisation workshop
- Re-frame problem? is there a need? If yes, workshop
- Understand 5 Why's
- Create problem statements
Tuesday, June 23, 2020
Data-driven Design - Adobe
Data-Informed vs. Data-Driven approach to design
======================================
Data-driven: use this approach when you want to grow or optimize specific areas for e.g. signup percentages, views, clicks, etc. Data-driven is useful when there is a lot of traffic or users to collect the data.
Data-informed: use this approach when you are making design decisions that evaluate high-level user motivations, expectations, perceptions, or emotions. This helps in contexts where you are focusing on strategic decisions. For e.g. long term customer retention rates.
Quantitative vs. Qualitative
===================
- Quantitative data tells WHAT is happening or NOT happening. It's usually numeric data.
- Qualitative data tells WHY something is happening. Are not numeric.
Example - Google Analytics.
Quantitative data -- tells how many visitors come to your website, what they click, what they abandon. Doesn't tell why they may leave midway, or take a specific action on your website.
Qualitative data -- Why is one piece of content on your website more interesting compared to another is the insight we can get only when we do qualitative analysis.
Note: We should never trust one type of data to understand your product's usage patterns. Both Quantitative and Qualitative go together. Quantitative data tells you the current status, while qualitative gives you perspective.
Example:
- To understand how your product is performing, you can look at the usage data (quantitative) -- how certain features are being used / not used.
- However quantitative data doesn't tell why some users use or don't use certain features. For that, you will need to do qualitative analysis.
DATA HELPS IN FORMULATING A HYPOTHESIS ABOUT A PROBLEM AND HOW TO SOLVE IT!

Slow thinking manifesto

People tend to “think fast”*. This can lead to undesirable effects. The items on the left side facilitate “slow thinking”. They improve the quality of the right side and should therefore be applied consciously and intensively.
Apply the items on the left side one time more than your intuition tells you to!

Pic Courtesy: Mohd. Umar Farooq on LinkedIn
Friday, June 19, 2020

Subscribe to:
Posts (Atom)


